Wednesday, 22 February 2012

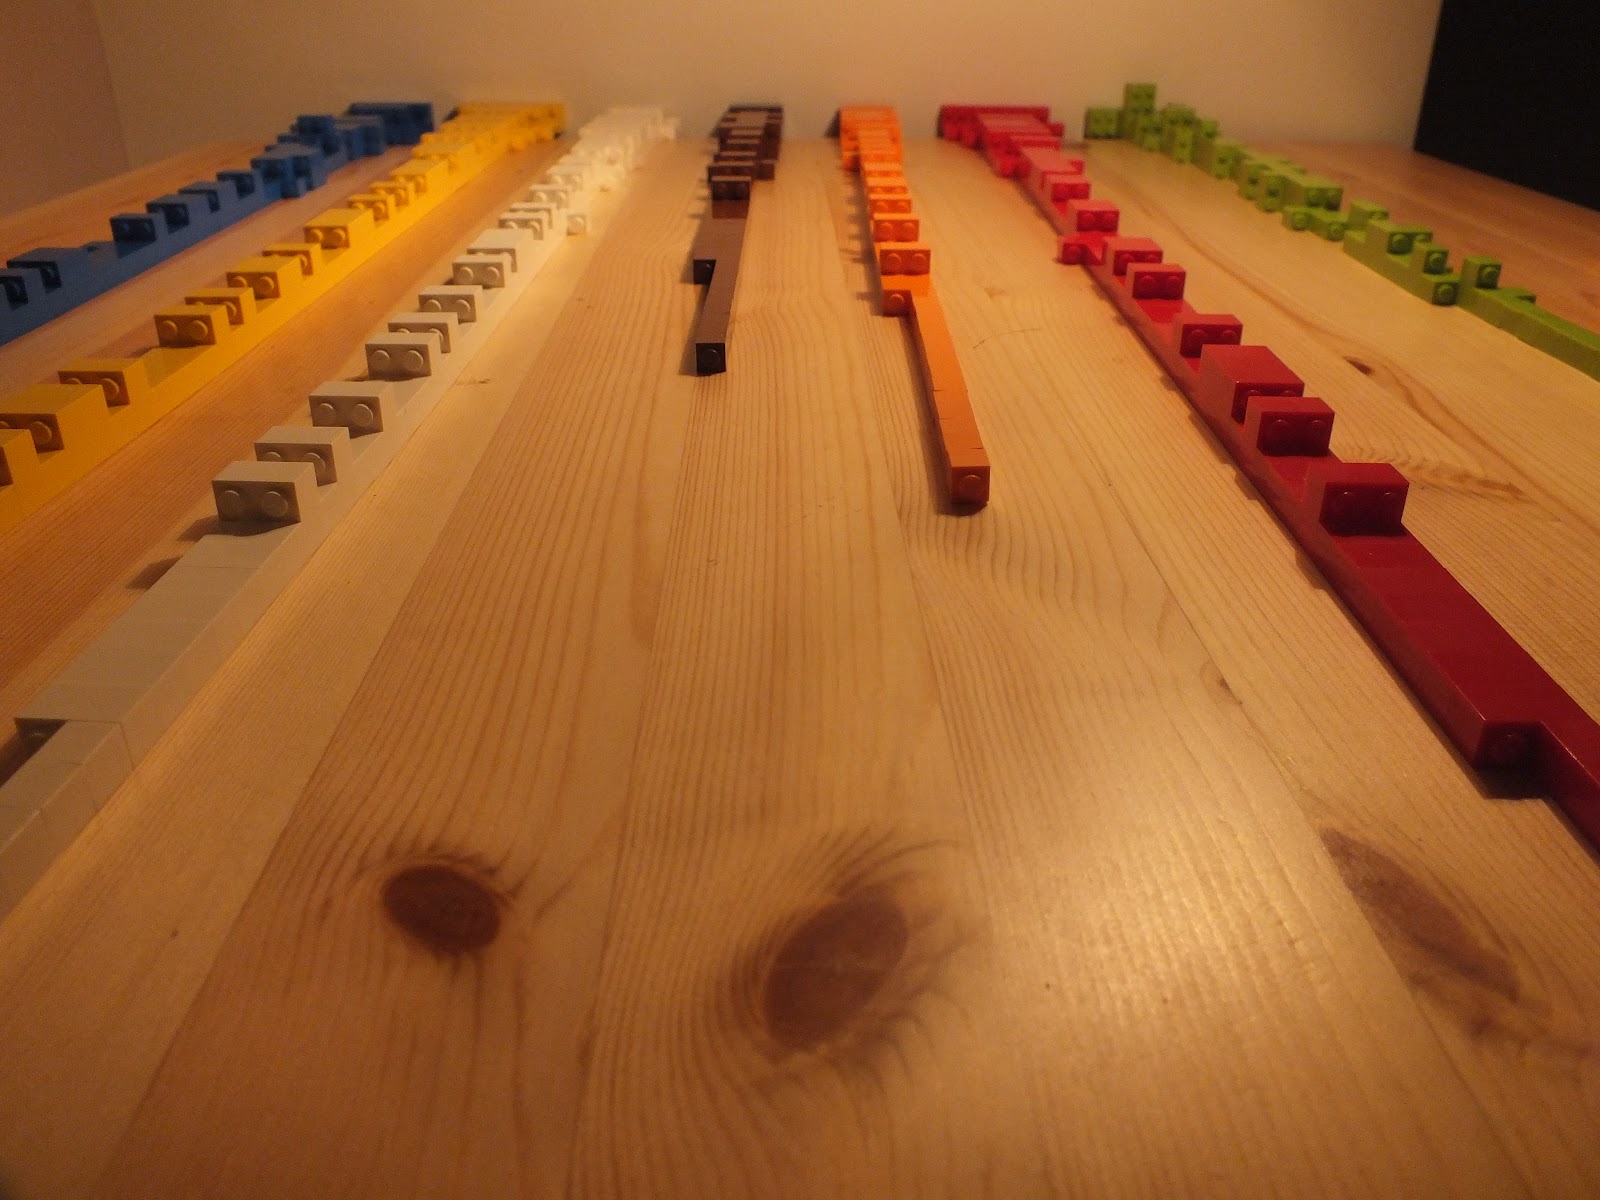
Lego Columns


Similar to the contained Lego idea but displayed differently, the corresponding number of bricks this time laid out in a column formation. I think it looked like dripping paint by the time is was completed...

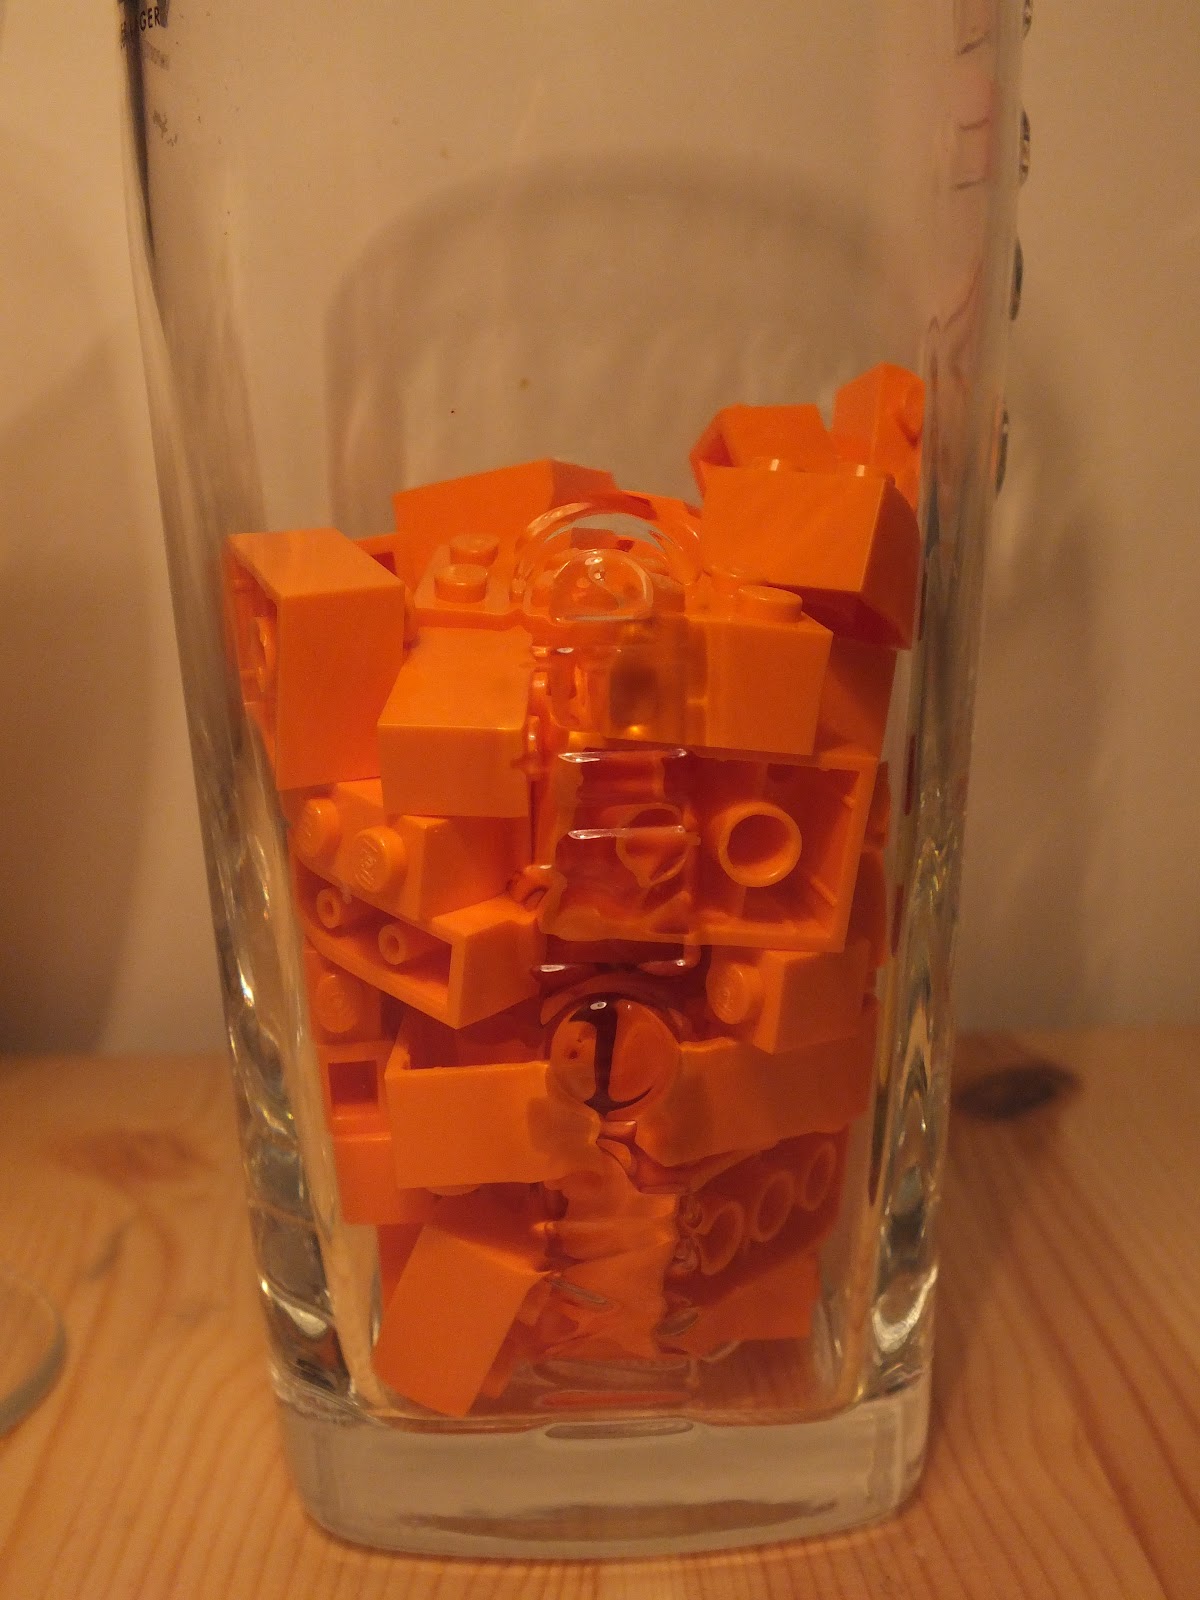
Contained Lego


A collection of photographs demonstrating an unusual use of Lego, instead of constructing something with the bricks I have placed them in various sized glasses. Each one representing a certain day of the week (Monday 7th November 2011 to Sunday 13th November 2011), the number of the bricks correspond to the amount of times I clicked my fingernails on each day.

Sunday, 19 February 2012

Labels?


After some comments about the images being too hard to understand and not providing enough information, I thought that some simple labelling might help. So I have added a title to one of them explaining what the graph is documenting and the relevant dates and the other with the individual dates attached to the balloons. I think this labelling idea has worked but needs to be refined, a bit more subtle. But are the labels now making the work to obvious so you (the audience) no longer having to think about the work. 

Monday, 13 February 2012

Artist Auction

Part of our fundraising campaign we are holding an online auction. Numerous artists have submitted original works on a post card sale. If you would like to own an original work click on the link below and follow the instructions.
Happy bidding!!
Love From Lincoln

Thursday, 9 February 2012

Lego Structures

Some very basic lego structures, no information/data used. Just getting a taster for what the structures could look like and what form they could take.
Think I might have to invest in some more lego, unless I only want a small structure.


Monday, 6 February 2012

Mass Data

Trying to show the quantity of data that I have collected, this is only a small scale piece (sketchbook size). Hopefully will be translated into a larger format maybe wall sized scale.


Lego

Bought a large box of lego. I am going to experiment building graphs or structures that could represent the data coherently.

Thinking about the feasibility of making the piece interactive, providing data so people could build their own?